Managing and monitoring a microservices architecture is no brainer with the Micronaut framework. In my previous post, we implemented an API gateway to our reactive Maps service which used Micronaut’s Consul integration for discovery and provided automatic client-side load balancing. In this post, let us look at implementing some of the monitoring capabilities to our Maps Micronaut application.
First, we will enable distributed tracing for our application using Micronaut’s Zipkin integration which will be helpful for troubleshooting latency issues with our microservices architecture. Add these dependencies to your gateway module’s build.gradle:
compile "io.micronaut:micronaut-tracing"
runtime 'io.zipkin.brave:brave-instrumentation-http'
runtime 'io.zipkin.reporter2:zipkin-reporter'
compile 'io.opentracing.brave:brave-opentracing'
Then we need to enable Zipkin in our application configuration so traces are sent to a local Zipkin server.
tracing:
  zipkin:
    http:
      url: http://localhost:9411
    enabled: true
    sampler:
      probability: 1
Start your Zipkin server using docker:
docker run -d -p 9411:9411 openzipkin/zipkin
Let’s add tracing span annotations to our API in Gateway controller.
    @Get("/{provider}")
    @ContinueSpan
    public Single<List<Direction>> map(@SpanTag("maps.provider") @NotBlank MapProvider provider, @SpanTag("maps.src") @NotBlank @QueryValue String src, @SpanTag("maps.dest") @NotBlank @QueryValue String dest) {
        return mapClient.map(provider, src, dest);
    }
Restart the gateway service and invoke this API via curl:
curl "http://localhost:8080/api/maps/google?src=apple&dest=google"
Zipkin UI shows our traces to this API call, navigate to http://localhost:9411/zipkin and select the span name to this API.
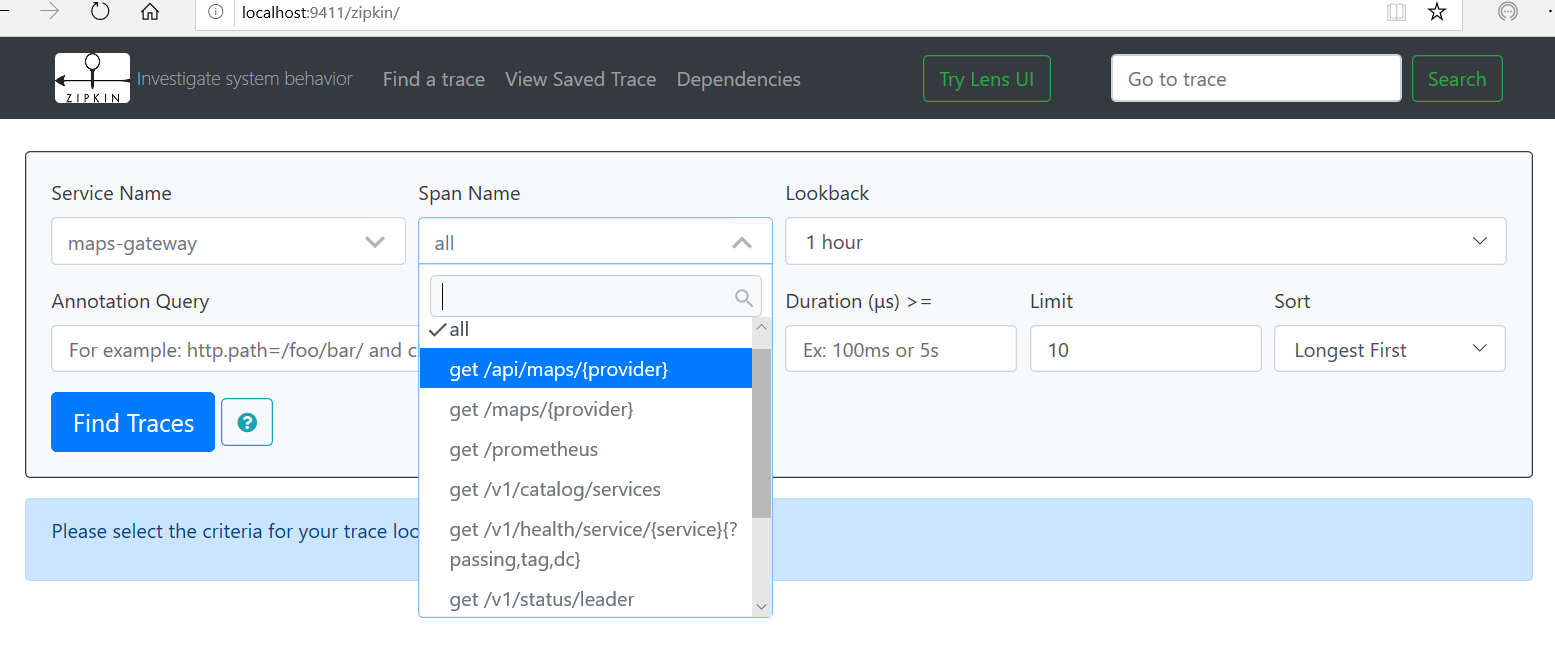
Clicking Find Traces should pull the traces to this API call.

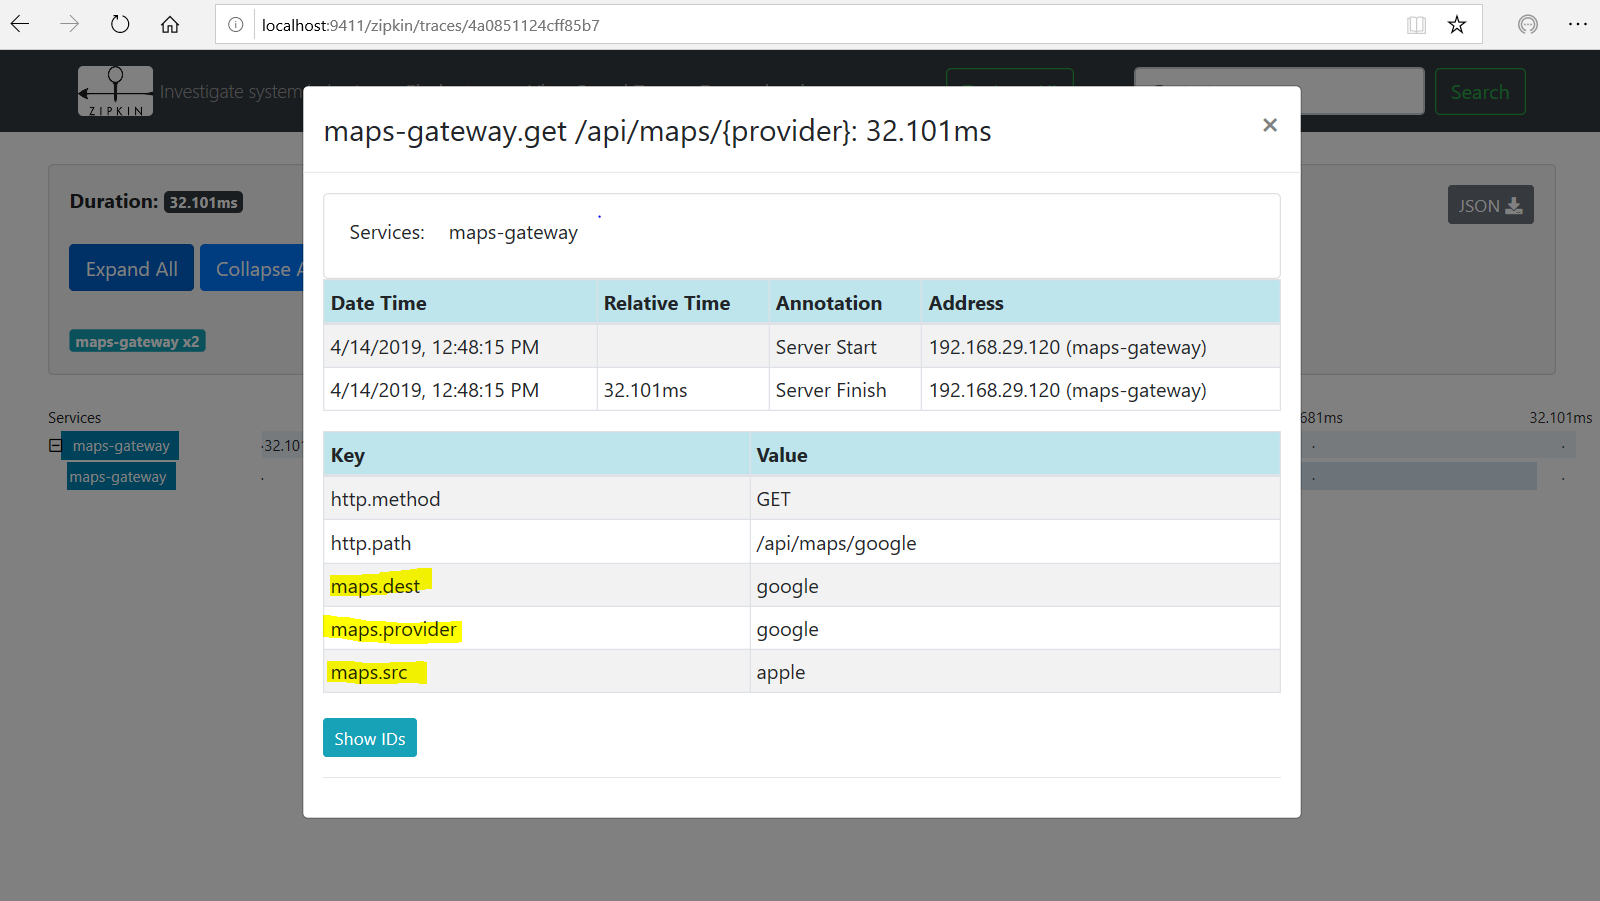
Clicking the first result shows the tags we have configured on our API.
Next, we will enable management for our application, add these dependencies to your gateway module’s build.gradle:
    compile "io.micronaut:micronaut-management"
    compile "io.micronaut.configuration:micronaut-micrometer-core"
    compile "io.micronaut.configuration:micronaut-micrometer-registry-prometheus"
This enables Micronaut’s metrics integration using Micrometer and Prometheus registry for monitoring.
micronaut:
  metrics:
    enabled: true
    export:
      prometheus:
        enabled: true
        step: PT1M
        descriptions: true
Check out Micronaut’s Micrometer integration docs for details on different configuration options. A built-in Prometheus endpoint was added in Micronaut 1.1.
Let’s start the Prometheus server with our custom config derived from the default prometheus.yml:
prometheus.exe --config.file=prometheus-micronaut.yml
In our custom config, under the scrape_configs section, we specify our Micronaut prometheus endpoint and set the scrape interval to 5 seconds with the target set to our gateway service running at port 8080.
scrape_configs:
  # The job name is added as a label `job=<job_name>` to any timeseries scraped from this config.
    - job_name: 'prometheus'

      # metrics_path defaults to '/metrics'
      # scheme defaults to 'http'.

      static_configs:
      - targets: ['127.0.0.1:9090']

    - job_name: 'micronaut'
      metrics_path: '/prometheus'
      scrape_interval: 5s
      static_configs:
      - targets: ['127.0.0.1:8080']
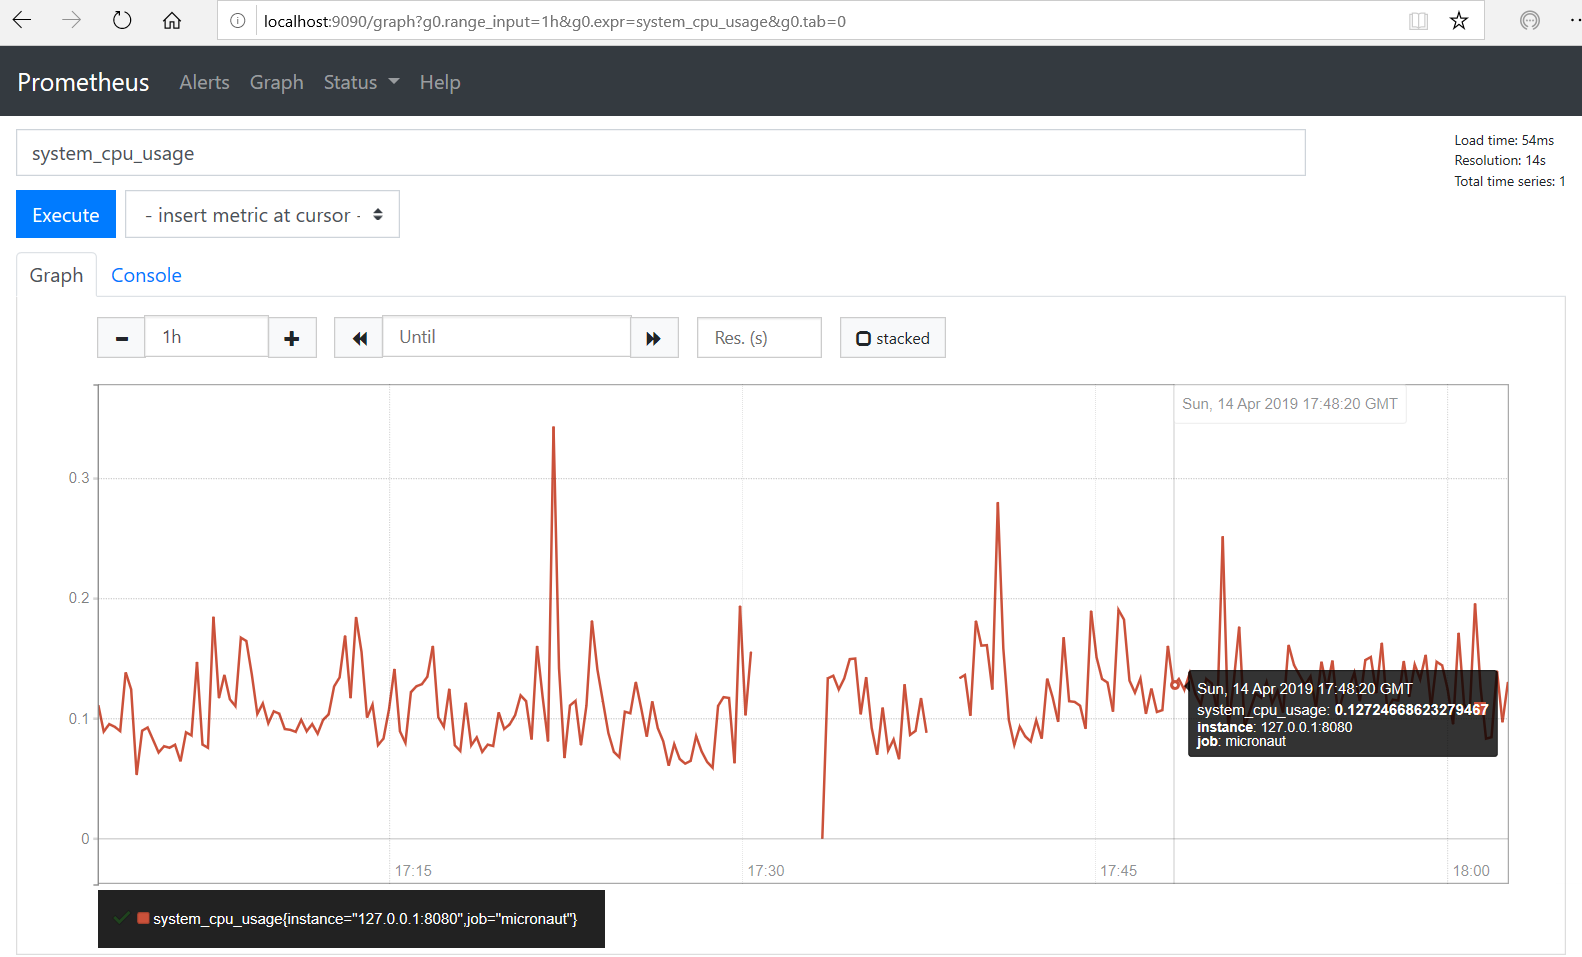
We can access the Prometheus UI at http://localhost:9090/graph and view the default system_cpu_usage metric for our gateway application.
Wouldn’t it be cool if we feed Prometheus metrics to Grafana dashboard instead?
Let’s give that a shot. Download latest version of Grafana and start the server and configure its Prometheus datasource to point to our local instance running at port 9090 and to test the setup, import built-in Prometheus 2.0 Stats dashboard in Grafana.
C:\tools\grafana-6.1.3\bin> .\grafana-server.exe
Navigate to Grafana Prometheus 2.0 Stats dashboard from http://localhost:3000

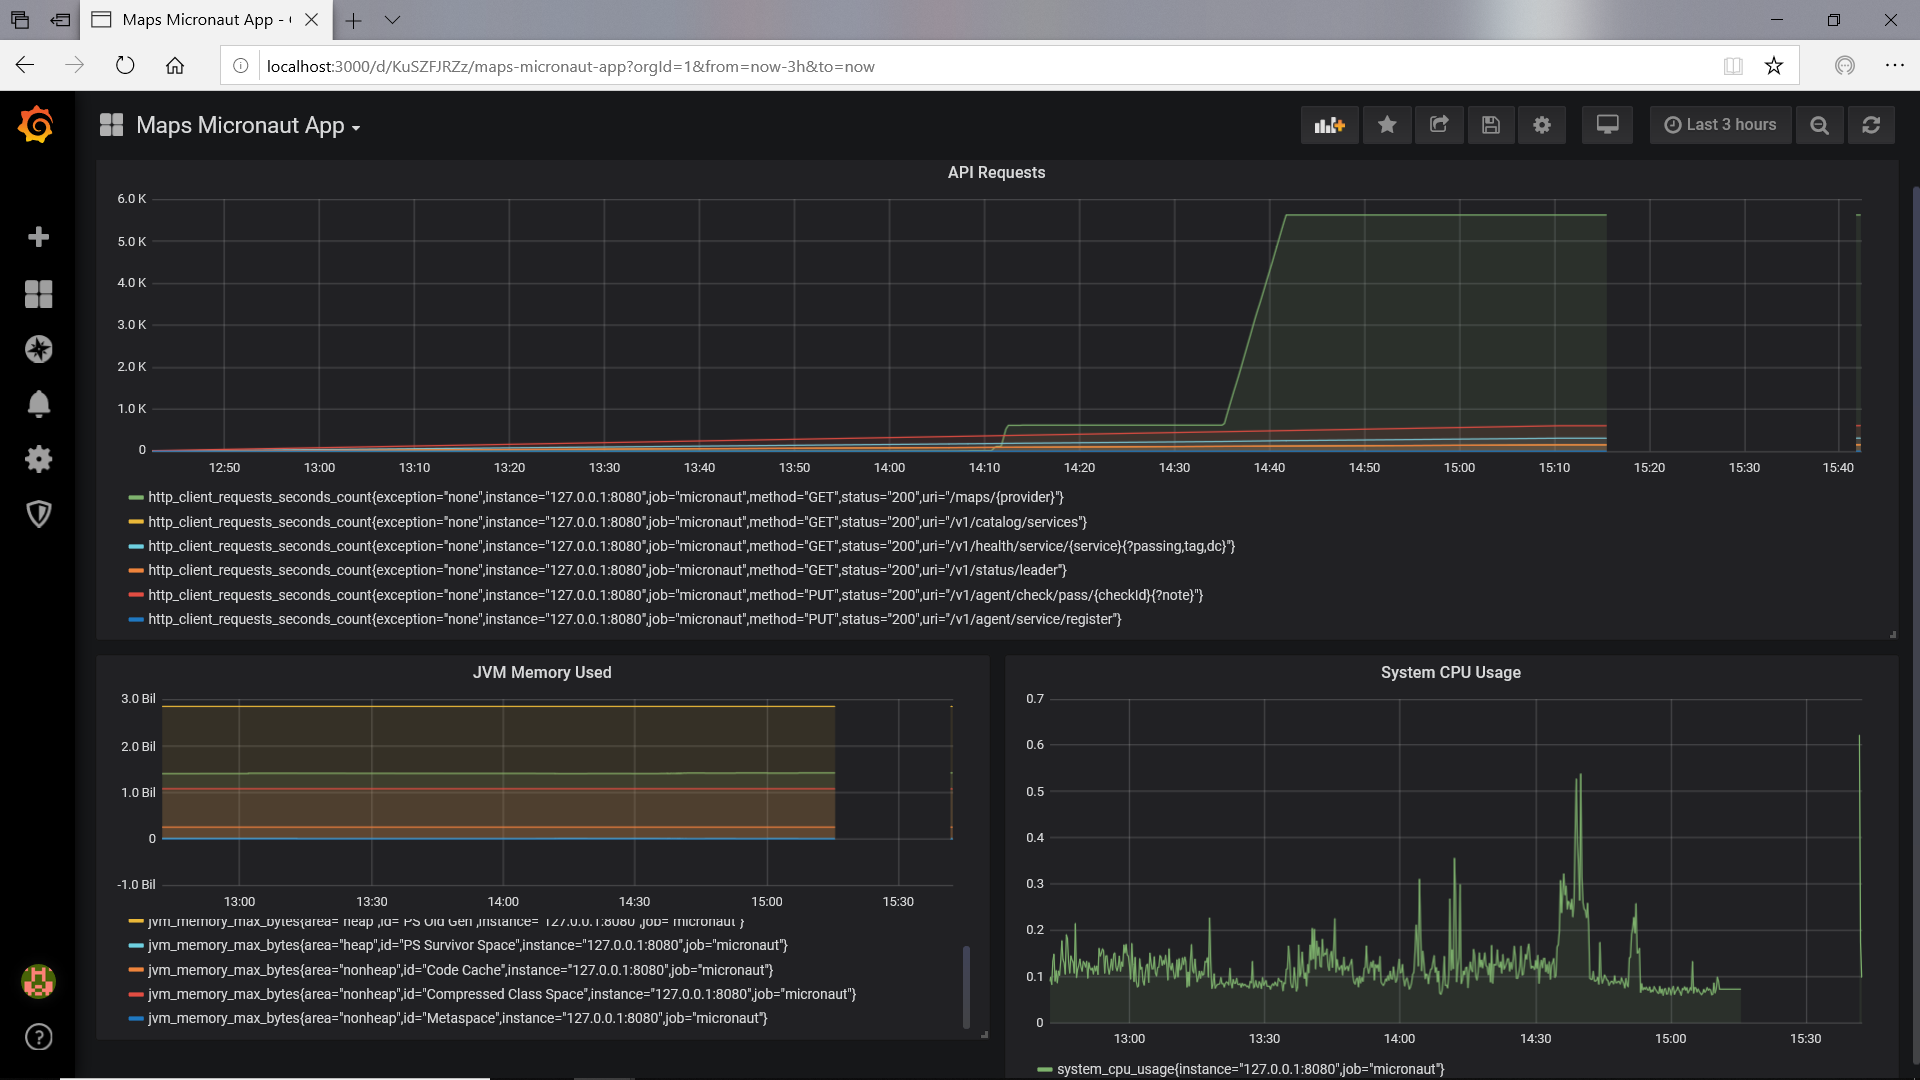
Let’s define a custom dashboard for our Maps Micronaut application. Create a dashboard and Query our Prometheus datasource for metrics data and display the http_client_requests_seconds_count, system_cpu_usage, jvm_memory_max_bytes metrics in different panels using a simple graph.
Now run a script file ‘run.bat 100’ to invoke our API via curl and varying the input, so we can simulate the load. This script invokes our API 100 times.
@echo off

FOR /L %%i IN (1,1,%1) DO (
  ECHO Calling API ... %%i
  curl "localhost:8080/api/maps/google?src=apple&dest=google"
)
You can see the live API metrics for our application dashboard.
Grafana provides a rich reporting dashboard and it provide capabilities such as Alerts for your metrics, so it makes a perfect monitoring solution for your microservices architecture.
Source code for the same application is available in GitHub.
